
LBO Financial Analysis Presentation Template — Finance & Consulting Template
7
Slides
16:9
Ratio
PPTX
Format
About this template
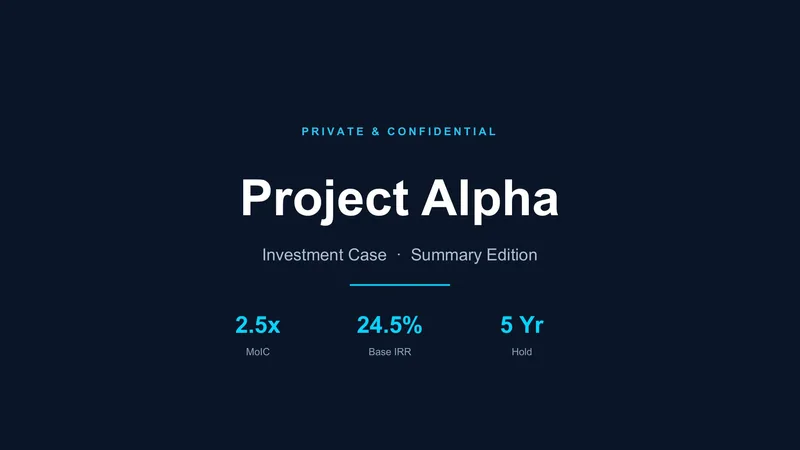
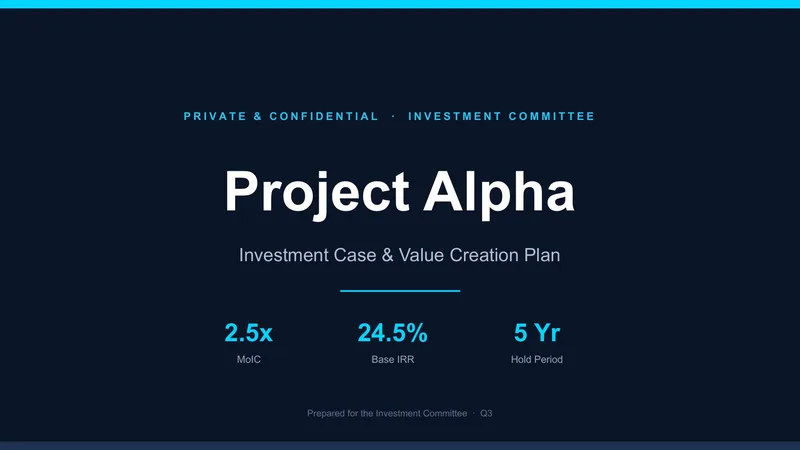
This premium Leveraged Buyout Analysis presentation template delivers a polished, institutional-grade deck designed for private equity and investment banking professionals. Built around a refined navy, slate, and steel-blue palette with strategic red accents, it projects analytical authority and clarity. The template features specialized financial layouts including a Sources & Uses acquisition table, Entry/Exit multiple sensitivity heatmap, product-line revenue stacked bars, debt paydown waterfall chart with covenant thresholds, valuation benchmarking comparisons, and Bear/Base/Bull scenario summary cards. Every slide employs clean grid structures, bold typography, and data-forward visuals to communicate complex financial narratives with precision. Ideal for acquisition thesis presentations, the deck ensures your investment rationale, return profiles, and capital structure analysis leave a lasting impression on investment committees and stakeholders.
Purpose
Designed for presenting acquisition theses, return profiles, and capital structures to investment committees, limited partners, and senior stakeholders. Use it for private equity deal screening, investment memoranda, portfolio company reviews, fundraising pitches, MBA case competitions, corporate development proposals, lender presentations, and quarterly business reviews where rigorous, data-driven financial storytelling is essential.
Who it's for
Private equity associates, partners, and analysts; investment banking professionals; corporate development teams; CFOs and finance directors; valuation consultants; MBA students; and financial advisors who need to communicate complex LBO models, debt structures, and investment returns with institutional polish and clarity.
Customization notes
Adapt the deck to any target company by editing the title slide and replacing placeholder text throughout. Modify chart data via right-click "Edit Data" or the linked Excel sheets. Adjust the navy and red accent colors globally through PowerPoint's color theme to align with your firm's branding. Duplicate the scenario summary or sensitivity slides to model additional cases. Swap product categories in the revenue chart to match your target's business segments.