
Corporate Finance & Acquisition Analysis Deck — Finance & Consulting Template
You must be signed in to purchase.
12
Slides
16:9
Ratio
PPTX
Format
About this template
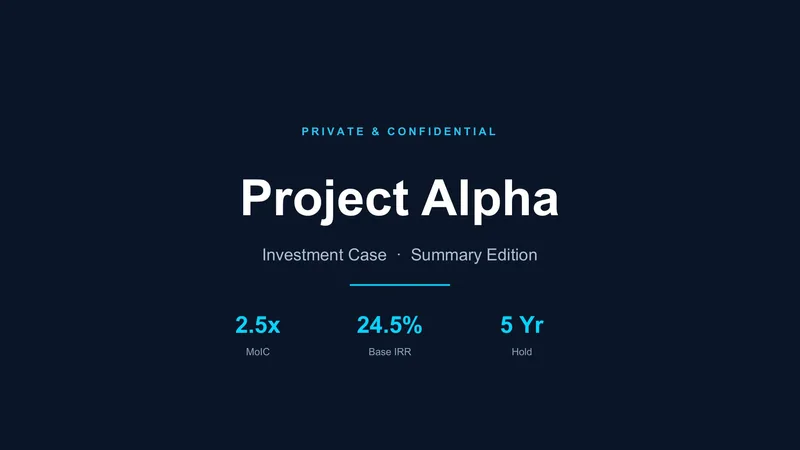
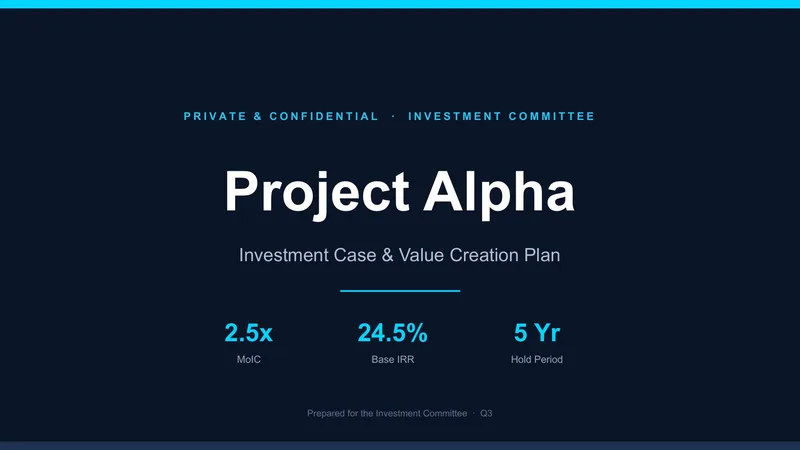
This comprehensive financial presentation template is expertly designed for investment committees, private equity analysts, and corporate development teams. Featuring a clean, highly professional, and data-driven aesthetic, this deck employs a minimalist blue and grey color palette to keep the focus entirely on your financial metrics and strategic narrative. Key layout features include complex but easily readable waterfall charts for DCF valuation, scatter plots for comparable company analysis, and meticulously structured pro forma income statement tables. Whether you are presenting a discounted cash flow analysis, outlining LBO structuring, or demonstrating sensitivity scenarios with tornado charts, this template provides all the essential visual frameworks. Users should choose this template to save hours of design time while ensuring their acquisition analyses, capital structure matrices, and investment theses are communicated with absolute clarity and institutional-grade professionalism.
Purpose
The primary use cases for this deck include presenting investment committee memos, detailing merger and acquisition (M&A) proposals, and delivering comprehensive valuation analyses. It is perfectly suited for pitching private equity buyouts, outlining strategic corporate acquisitions, showcasing discounted cash flow (DCF) outputs, and walking stakeholders through historical financial performance and future capital expenditure projections.
Who it's for
This deck is purpose-built for investment bankers, private equity professionals, corporate development executives, and financial analysts. It will also heavily benefit CFOs and financial consultants who need to present rigorous quantitative data and acquisition theses to board members or institutional investors.
Customization notes
All charts, including the NPV sensitivity tornado charts and DCF waterfall graphs, are fully editable to reflect your specific data inputs. You can quickly modify the standard blue and grey color scheme using the master slide settings to match your firm's brand identity. Simply duplicate the standardized matrix tables or financial projection slides to expand your forecast horizons.